Presentation Transcripts
Latest Update : June 5, 2024
Back to Financial Results (FY3/2024)
Investor Meeting Presentation for FY 3/2024 held on May 10, 2024
Table of Contents
- Cover
- Today's Agenda
- Financial Results
- Summary of Consolidated Business Results
- Summary of Consolidated Business Results for 4Q
- Net Sales, Operating Income / Margin Year
- Net Sales, Operating Income / Margin Quarter
- 4Q Actual: Differences from the Forecast as of February
- Precision Technologies (PT) Year
- Precision Technologies (PT) Quarter
- Motor, Lighting & Sensing (MLS) Year
- Motor, Lighting & Sensing (MLS) Quarter
- Semiconductors & Electronics (SE) Year
- Semiconductors & Electronics (SE) Quarter
- Access Solutions (AS) Year
- Access Solutions (AS) Quarter
- Profit Attributable to Owners of the Parent / EPS Year
- Profit Attributable to Owners of the Parent / EPS Quarter
- Inventory
- Net Interest-bearing Debt / Free Cash Flow
- Forecast
- Forecast for Business Segment
- Management Policy & Business Strategy
- Summary of FY3/24
- Key Points of FY3/25 Forecast (1)
- Key Points of FY3/25 Forecast (2)
- Long-term Trend of Sales and OP
- Mid-term Business Plan
- Precision Technologies (PT) Targets
- Ball Bearing Business Situation
- Actions to Strengthen PT Business through M&A
- Motor, Lighting & Sensing (MLS) Targets
- Growth Potential of Motor Business
- Semiconductors & Electronics (SE) Targets
- Growth Potential of Power Semiconductor Business (1)
- Growth Potential of Power Semiconductor Business (2)
- Access Solutions (AS) Targets
- Create value and introduce new INTEGRATION products through aggressive activities (1)
- Create value and introduce new INTEGRATION products through aggressive activities (2)
- New Plant (Second Plant in Cambodia) to be Established
- Accelerating Carbon Neutral
- Dividends
- Forward-looking Statements
- Reference
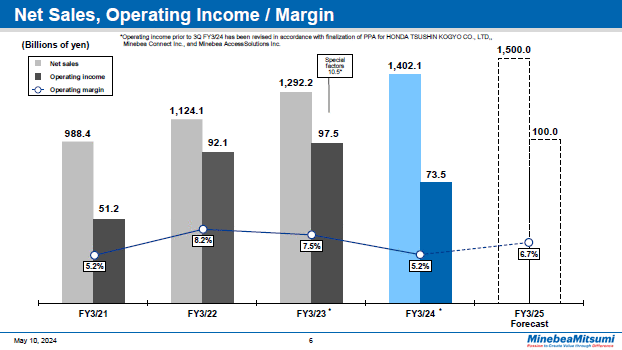
This is the annual trend in net sales, operating income and operating margin.
The bar graph on the left is net sales, and the one on the right is operating income along with a line chart for the operating margin. The operating margin for the fiscal year ended Mach 31, 2024 was 5.2%, down 2.3 percentage points year on year.
6page (total 58pages)
![]() You need Adobe Reader® to view these documents. Click on Adobe Reader icon on the left to download the software from the Adobe Systems website.
You need Adobe Reader® to view these documents. Click on Adobe Reader icon on the left to download the software from the Adobe Systems website.
It ends about main text.


