Presentation Transcripts
Latest Update : May 25, 2018
Back to Financial Results (FY3/2018)
Investor Meeting Presentation for FY 3/2018 held on May 8, 2018
Table of Contents
- Cover
- Today's Agenda
- Financial Results
- Summary of Consolidated Business Results
- Summary of Consolidated Business Results for 4Q
- Net Sales (Yearly)
- Net Sales (Quarterly)
- Operating Income (Yearly)
- Operating Income (Quarterly)
- Machined Components (Yearly)
- Machined Components (Quarterly)
- Electronic Devices & Components (Yearly)
- Electronic Devices & Components (Quarterly)
- Mitsumi Business (Yearly)
- Mitsumi Business (Quarterly)
- Net Income (Yearly)
- Net Income (Quarterly)
- S.G. & A. Expenses
- Inventories
- Capital Expenditure & Depreciation
- Net Interest-Bearing Debt/Free Cash Flow
- Forecast for Fiscal Year Ending March 31, 2019
- Forecast for Business Segment
- Shareholders Return
- Management Policy & Business Strategy
- Summary of Fiscal Year ended 3/18
- Summary of Fiscal Year ending 3/19
- Mid-term Business Plan Targets
- Machined Components Targets
- Ball Bearing Business Strategy
- Automobile Parts Adoption Rate and Global Automobile Shipment Forecasts
- Number of Bearings per Vehicle
- Demand for Bearings: Cooling Fans for Data Centers
- Demand for Bearings: Drones (Unmanned Aerial Vehicles)
- Aircraft Components Business Strategy
- Pivot Assembly (HDD) Business Strategy
- Electronic Devices and Components Targets
- Motor Business Strategy
- Open China Technical Center
- LED Backlight Business Strategy
- "MINEGE™" Strategy (Sensing Device Business)
- Mitsumi Business Targets
- Optical Devices/Mechanical Parts Business Strategy
- Mitsumi Core Business Strategy
- New Product Trio
- Mid-term Business Plan: Targets by Segment
- EBITDA/Net interest-bearing debts/Free cash flows
- Shareholder Return Policy
- Forward-looking Statements
- Reference
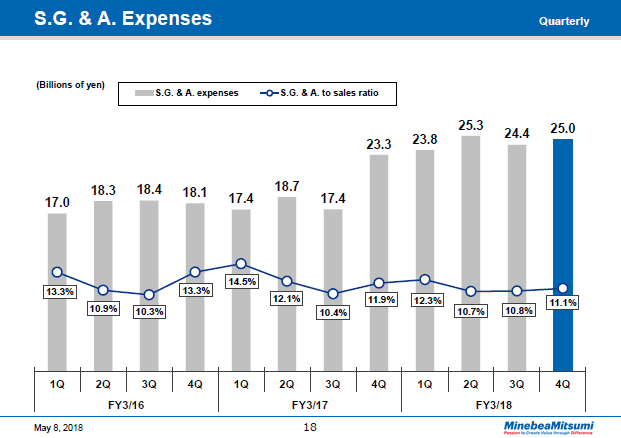
The bar graph here shows quarterly trends in SG&A expenses while the line graph charts changes in the SG&A expenses-to-sales ratio.
SG&A expenses rose 0.6 billion yen quarter on quarter to hit 25.0 billion yen while the SG&A expenses-to-sales ratio remained about as low as it was in the previous quarter at 11.1%.
18page (total 54pages)
![]() You need Adobe Reader® to view these documents. Click on Adobe Reader icon on the left to download the software from the Adobe Systems website.
You need Adobe Reader® to view these documents. Click on Adobe Reader icon on the left to download the software from the Adobe Systems website.
It ends about main text.


