Presentation Transcripts
Latest Update : May 25, 2018
Back to Financial Results (FY3/2018)
Investor Meeting Presentation for FY 3/2018 held on May 8, 2018
- Cover
- Today's Agenda
- Financial Results
- Summary of Consolidated Business Results
- Summary of Consolidated Business Results for 4Q
- Net Sales (Yearly)
- Net Sales (Quarterly)
- Operating Income (Yearly)
- Operating Income (Quarterly)
- Machined Components (Yearly)
- Machined Components (Quarterly)
- Electronic Devices & Components (Yearly)
- Electronic Devices & Components (Quarterly)
- Mitsumi Business (Yearly)
- Mitsumi Business (Quarterly)
- Net Income (Yearly)
- Net Income (Quarterly)
- S.G. & A. Expenses
- Inventories
- Capital Expenditure & Depreciation
- Net Interest-Bearing Debt/Free Cash Flow
- Forecast for Fiscal Year Ending March 31, 2019
- Forecast for Business Segment
- Shareholders Return
- Management Policy & Business Strategy
- Summary of Fiscal Year ended 3/18
- Summary of Fiscal Year ending 3/19
- Mid-term Business Plan Targets
- Machined Components Targets
- Ball Bearing Business Strategy
- Automobile Parts Adoption Rate and Global Automobile Shipment Forecasts
- Number of Bearings per Vehicle
- Demand for Bearings: Cooling Fans for Data Centers
- Demand for Bearings: Drones (Unmanned Aerial Vehicles)
- Aircraft Components Business Strategy
- Pivot Assembly (HDD) Business Strategy
- Electronic Devices and Components Targets
- Motor Business Strategy
- Open China Technical Center
- LED Backlight Business Strategy
- "MINEGE™" Strategy (Sensing Device Business)
- Mitsumi Business Targets
- Optical Devices/Mechanical Parts Business Strategy
- Mitsumi Core Business Strategy
- New Product Trio
- Mid-term Business Plan: Targets by Segment
- EBITDA/Net interest-bearing debts/Free cash flows
- Shareholder Return Policy
- Forward-looking Statements
- Reference
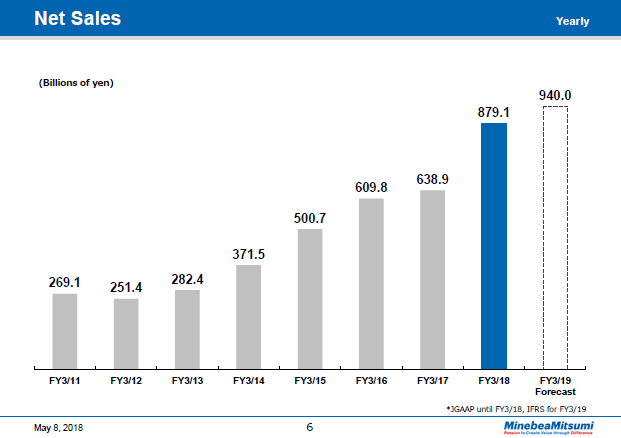
This graph shows annual sales trends.
In the fiscal year ended March 31, 2018, we recorded a new high of 879.1 billion yen by a wide margin.
The forecast for the fiscal year ending March 31, 2019 is shown by segment.
Also, as we have decided to voluntarily adopt International Financial Reporting Standards (hereinafter referred to as "IFRS") from the current fiscal year (fiscal year ending March 31, 2019), forecast has been calculated based on IFRS.
For this reason, we cannot directly compare the results with those of the previous fiscal year (fiscal year ended March 2018) which were applied under Japanese GAAP, but these figures are presented alongside for your reference.
The same applies to the forecast figures for each subsequent slide.
6page (total 54pages)
![]() You need Adobe Reader® to view these documents. Click on Adobe Reader icon on the left to download the software from the Adobe Systems website.
You need Adobe Reader® to view these documents. Click on Adobe Reader icon on the left to download the software from the Adobe Systems website.
It ends about main text.


