Presentation Transcripts
Latest Update : May 25, 2018
Back to Financial Results (FY3/2018)
Investor Meeting Presentation for FY 3/2018 held on May 8, 2018
- Cover
- Today's Agenda
- Financial Results
- Summary of Consolidated Business Results
- Summary of Consolidated Business Results for 4Q
- Net Sales (Yearly)
- Net Sales (Quarterly)
- Operating Income (Yearly)
- Operating Income (Quarterly)
- Machined Components (Yearly)
- Machined Components (Quarterly)
- Electronic Devices & Components (Yearly)
- Electronic Devices & Components (Quarterly)
- Mitsumi Business (Yearly)
- Mitsumi Business (Quarterly)
- Net Income (Yearly)
- Net Income (Quarterly)
- S.G. & A. Expenses
- Inventories
- Capital Expenditure & Depreciation
- Net Interest-Bearing Debt/Free Cash Flow
- Forecast for Fiscal Year Ending March 31, 2019
- Forecast for Business Segment
- Shareholders Return
- Management Policy & Business Strategy
- Summary of Fiscal Year ended 3/18
- Summary of Fiscal Year ending 3/19
- Mid-term Business Plan Targets
- Machined Components Targets
- Ball Bearing Business Strategy
- Automobile Parts Adoption Rate and Global Automobile Shipment Forecasts
- Number of Bearings per Vehicle
- Demand for Bearings: Cooling Fans for Data Centers
- Demand for Bearings: Drones (Unmanned Aerial Vehicles)
- Aircraft Components Business Strategy
- Pivot Assembly (HDD) Business Strategy
- Electronic Devices and Components Targets
- Motor Business Strategy
- Open China Technical Center
- LED Backlight Business Strategy
- "MINEGE™" Strategy (Sensing Device Business)
- Mitsumi Business Targets
- Optical Devices/Mechanical Parts Business Strategy
- Mitsumi Core Business Strategy
- New Product Trio
- Mid-term Business Plan: Targets by Segment
- EBITDA/Net interest-bearing debts/Free cash flows
- Shareholder Return Policy
- Forward-looking Statements
- Reference
Now let's look at the electronic devices & components segment.
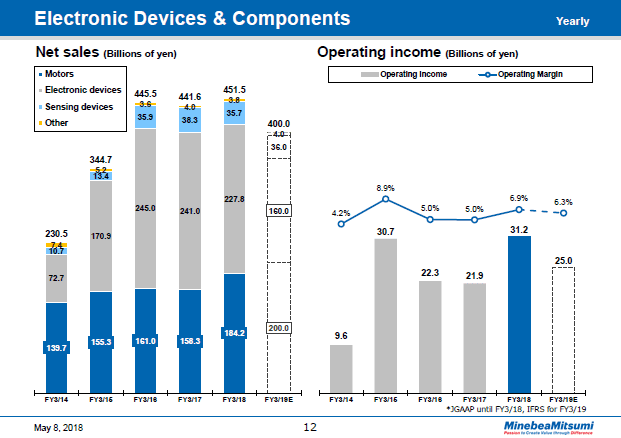
In the fiscal year ended March 31, 2018, net sales were up 2% year on year to total 451.5 billion yen.
Looking at the results by product we see that sales of motors increased 16% year on year to reach 184.2 billion yen mainly due to automobiles. While electronic devices sales dropped 5% year on year to hit 227.8 billion yen, demand for our ultra-thin LED backlights remained strong, surpassing initial targets, despite declining sales of final products sold by our major customers. Net sales of sensing devices decreased 7% year on year to total 35.7 billion yen.
Operating income climbed 42% year on year to reach 31.2 billion yen while the operating margin rose 1.9 percentage points to reach 6.9%.
Looking at operating income by product, we see that electronic devices were way up, sensing devices were down, and motors remained steady.
In the fiscal year ending March 31, 2019, we anticipate an increase in motor sales and profits due to the continued increase in demand, mainly for automobiles, and a decrease in sales of electronic devices due to a drop in parts supplied for a fee. We also anticipate a slight increase in sales of sensing devices and an improvement in profitability.
12page (total 54pages)
![]() You need Adobe Reader® to view these documents. Click on Adobe Reader icon on the left to download the software from the Adobe Systems website.
You need Adobe Reader® to view these documents. Click on Adobe Reader icon on the left to download the software from the Adobe Systems website.
It ends about main text.


