Presentation Transcripts
Latest Update : May 25, 2018
Back to Financial Results (FY3/2018)
Investor Meeting Presentation for FY 3/2018 held on May 8, 2018
- Cover
- Today's Agenda
- Financial Results
- Summary of Consolidated Business Results
- Summary of Consolidated Business Results for 4Q
- Net Sales (Yearly)
- Net Sales (Quarterly)
- Operating Income (Yearly)
- Operating Income (Quarterly)
- Machined Components (Yearly)
- Machined Components (Quarterly)
- Electronic Devices & Components (Yearly)
- Electronic Devices & Components (Quarterly)
- Mitsumi Business (Yearly)
- Mitsumi Business (Quarterly)
- Net Income (Yearly)
- Net Income (Quarterly)
- S.G. & A. Expenses
- Inventories
- Capital Expenditure & Depreciation
- Net Interest-Bearing Debt/Free Cash Flow
- Forecast for Fiscal Year Ending March 31, 2019
- Forecast for Business Segment
- Shareholders Return
- Management Policy & Business Strategy
- Summary of Fiscal Year ended 3/18
- Summary of Fiscal Year ending 3/19
- Mid-term Business Plan Targets
- Machined Components Targets
- Ball Bearing Business Strategy
- Automobile Parts Adoption Rate and Global Automobile Shipment Forecasts
- Number of Bearings per Vehicle
- Demand for Bearings: Cooling Fans for Data Centers
- Demand for Bearings: Drones (Unmanned Aerial Vehicles)
- Aircraft Components Business Strategy
- Pivot Assembly (HDD) Business Strategy
- Electronic Devices and Components Targets
- Motor Business Strategy
- Open China Technical Center
- LED Backlight Business Strategy
- "MINEGE™" Strategy (Sensing Device Business)
- Mitsumi Business Targets
- Optical Devices/Mechanical Parts Business Strategy
- Mitsumi Core Business Strategy
- New Product Trio
- Mid-term Business Plan: Targets by Segment
- EBITDA/Net interest-bearing debts/Free cash flows
- Shareholder Return Policy
- Forward-looking Statements
- Reference
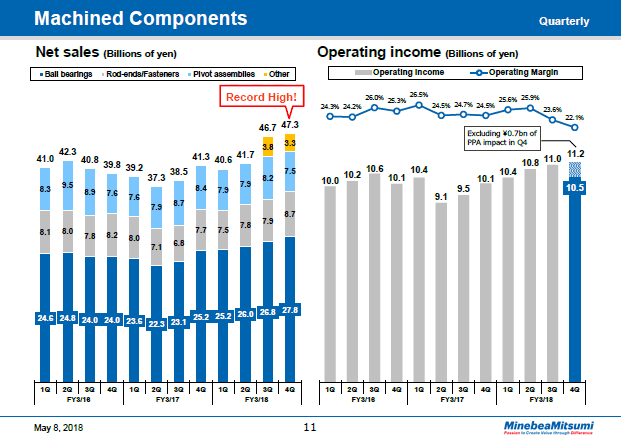
This slide shows the quarterly trends in the machined components segment.
In the fourth quarter, net sales were up 1% over the previous quarter for a record-high total of 47.3 billion yen.
Sales of ball bearings increased 4% quarter on quarter to hit 27.8 billion yen. The volume of ball bearings sold outside the group hit 198 million units per month in average, marking a year on year increase for the 22nd quarter in a row. The production volume reached a record high of 288 million units in March, and we achieved our target of increasing monthly production capacity to 285 million units by April of this year.
Revenue from rod-ends and fasteners were up 10% over the previous quarter to total 8.7 billion yen, and even though revenue from pivot assemblies dropped 9% from the previous quarter to hit 7.5 billion yen, our ability to maintain an 80% share of the market has generated stable earnings.
Operating income for the fourth quarter was down 5% from the previous quarter to total 10.5 billion yen while the operating margin decreased 1.5 percentage points to reach 22.1%.
If we were to exclude the 0.7 billion yen of PPA impact, operating income would have been up 1% from the previous quarter to total 11.2 billion yen and the operating margin would have been up 0.1 percentage points at 23.7%.
Looking at the results by product, we see that profits for ball bearings and rod-ends/fasteners rose while profits for pivot assemblies fell.
11page (total 54pages)
![]() You need Adobe Reader® to view these documents. Click on Adobe Reader icon on the left to download the software from the Adobe Systems website.
You need Adobe Reader® to view these documents. Click on Adobe Reader icon on the left to download the software from the Adobe Systems website.
It ends about main text.


