Presentation Transcripts
Latest Update : May 25, 2018
Back to Financial Results (FY3/2018)
Investor Meeting Presentation for FY 3/2018 held on May 8, 2018
- Cover
- Today's Agenda
- Financial Results
- Summary of Consolidated Business Results
- Summary of Consolidated Business Results for 4Q
- Net Sales (Yearly)
- Net Sales (Quarterly)
- Operating Income (Yearly)
- Operating Income (Quarterly)
- Machined Components (Yearly)
- Machined Components (Quarterly)
- Electronic Devices & Components (Yearly)
- Electronic Devices & Components (Quarterly)
- Mitsumi Business (Yearly)
- Mitsumi Business (Quarterly)
- Net Income (Yearly)
- Net Income (Quarterly)
- S.G. & A. Expenses
- Inventories
- Capital Expenditure & Depreciation
- Net Interest-Bearing Debt/Free Cash Flow
- Forecast for Fiscal Year Ending March 31, 2019
- Forecast for Business Segment
- Shareholders Return
- Management Policy & Business Strategy
- Summary of Fiscal Year ended 3/18
- Summary of Fiscal Year ending 3/19
- Mid-term Business Plan Targets
- Machined Components Targets
- Ball Bearing Business Strategy
- Automobile Parts Adoption Rate and Global Automobile Shipment Forecasts
- Number of Bearings per Vehicle
- Demand for Bearings: Cooling Fans for Data Centers
- Demand for Bearings: Drones (Unmanned Aerial Vehicles)
- Aircraft Components Business Strategy
- Pivot Assembly (HDD) Business Strategy
- Electronic Devices and Components Targets
- Motor Business Strategy
- Open China Technical Center
- LED Backlight Business Strategy
- "MINEGE™" Strategy (Sensing Device Business)
- Mitsumi Business Targets
- Optical Devices/Mechanical Parts Business Strategy
- Mitsumi Core Business Strategy
- New Product Trio
- Mid-term Business Plan: Targets by Segment
- EBITDA/Net interest-bearing debts/Free cash flows
- Shareholder Return Policy
- Forward-looking Statements
- Reference
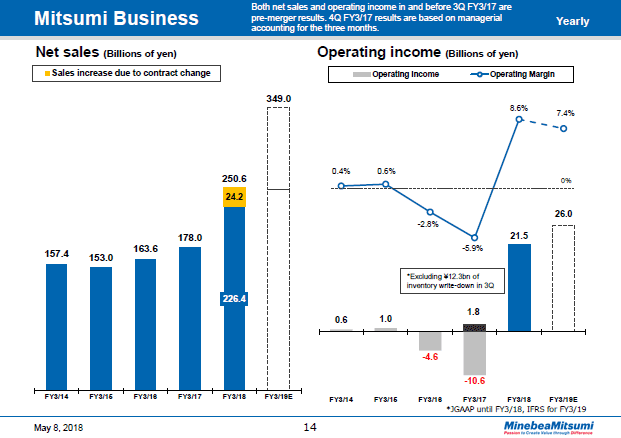
Finally, let's look at the performance for the Mitsumi business segment including the figures before the merger.
Net sales increased 41% to total 250.6 billion yen in the fiscal year ended March 31, 2018.
If we were to exclude the 24.2 billion yen of sales increase due to contract change with customers, they would represent a 27% year on year increase.
This bump was mainly due to a large increase in shipments of new game consoles during the peak demand period and an increase in camera actuators for major customers.
Year on year, operating income improved 32.1 billion yen and, even after the adjustment of inventory write-downs, increased 19.7 billion yen to total 21.5 billion yen while the operating margin reached 8.6%. This jump was due to a significant improvement in overall productivity and an increase in shipments of new game consoles and camera actuators.
In the fiscal year ending March 31, 2019, net sales are expected to rise due to increase in shipments of new game consoles and actuators for cameras. Also, we anticipate approximately 100 billion yen of sales increase due to contract change with customers.
Operating income is expected to get a boost from an increase in shipments, and if we exclude the impact of the above-mentioned sales increase due to contract change, the operating margin should see growth as well.
14page (total 54pages)
![]() You need Adobe Reader® to view these documents. Click on Adobe Reader icon on the left to download the software from the Adobe Systems website.
You need Adobe Reader® to view these documents. Click on Adobe Reader icon on the left to download the software from the Adobe Systems website.
It ends about main text.


