Presentation Transcripts
Latest Update : June 2, 2021
Back to Financial Results (FY3/2021)
Investor Meeting Presentation for FY 3/2021 held on May 7, 2021
- Cove
- Today's Agenda
- Financial Results
- Summary of Consolidated Business Results
- Summary of Consolidated Business Results for 4Q
- Net Sales, Operating Income/margin Year
- Net Sales, Operating Income/margin Quarter
- 4Q Actual: Differences from the Forecast as of February
- Machined Components Year
- Machined Components Quarter
- Electronic Devices & Components Year
- Electronic Devices & Components Quarter
- Mitsumi Business Year
- Mitsumi Business Quarter
- U-Shin Business Year
- U-Shin Business Quarter
- Profit attributable to owners of the parent / EPS Year
- Profit attributable to owners of the parent / EPS Quarter
- Inventory
- Net interest-bearing debt / Free cash flow
- Forecast for Fiscal Year Ending March 31, 2022
- Forecast for Business Segment
- Changes of Business Segment
- Forecast for Business Segment (Adjusted)
- Management Policy & Business Strategy
- Summary of Fiscal Year ended 3/21
- Summary of Fiscal Year ending 3/22 Plan
- Mid-term Business Plan Targets
- Machined Components Targets
- Electronic Devices and Comp. (1) Targets
- Electronic Devices and Comp. (2) Motors
- Mitsumi Business (1) Targets
- Mitsumi Business (2) Optical Devices
- Mitsumi Business (3) Analog Semiconductors
- U-Shin Business Targets
- Construction of New Multi-purpose Factory
- Mission as CEO: Looking Back on My Tenure So Far
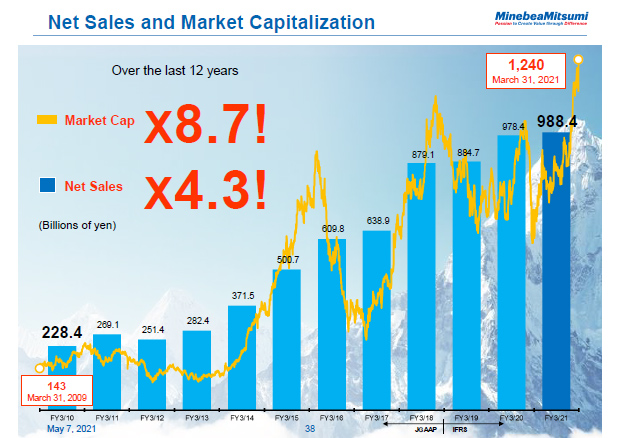
- Net Sales and Market Capitalization
- Path to 100 billion yen in operating income
- Mission as CEO: Looking Back on My Tenure So Far
- Laying the New Foundation for 100th Anniversary (1)
- Laying the New Foundation for 100th Anniversary (2)
- 70th Anniversary Dividend
- ESG Topics
- Forward-looking Statements
- Reference
This graph clearly shows the increase. During the first peak seen on the graph, it was only the profit from backlights that attracted attention. They were unexpectedly profitable products, but things don't always keep growing or work out the way you expect them to.
As I said at the last investor meeting, our business model is similar to UNIQLO's. In the same way that UNIQLO can grow steadily even if it can no longer sell fleece jackets, we can continue to grow even without backlights. This graph shows that the market has finally come to understand that.
38page (total 49pages)
![]() You need Adobe Reader® to view these documents. Click on Adobe Reader icon on the left to download the software from the Adobe Systems website.
You need Adobe Reader® to view these documents. Click on Adobe Reader icon on the left to download the software from the Adobe Systems website.
It ends about main text.


