


Presentation Transcripts
Latest Update : June 2, 2021
Back to Financial Results (FY3/2021)
Investor Meeting Presentation for FY 3/2021 held on May 7, 2021
- Cove
- Today's Agenda
- Financial Results
- Summary of Consolidated Business Results
- Summary of Consolidated Business Results for 4Q
- Net Sales, Operating Income/margin Year
- Net Sales, Operating Income/margin Quarter
- 4Q Actual: Differences from the Forecast as of February
- Machined Components Year
- Machined Components Quarter
- Electronic Devices & Components Year
- Electronic Devices & Components Quarter
- Mitsumi Business Year
- Mitsumi Business Quarter
- U-Shin Business Year
- U-Shin Business Quarter
- Profit attributable to owners of the parent / EPS Year
- Profit attributable to owners of the parent / EPS Quarter
- Inventory
- Net interest-bearing debt / Free cash flow
- Forecast for Fiscal Year Ending March 31, 2022
- Forecast for Business Segment
- Changes of Business Segment
- Forecast for Business Segment (Adjusted)
- Management Policy & Business Strategy
- Summary of Fiscal Year ended 3/21
- Summary of Fiscal Year ending 3/22 Plan
- Mid-term Business Plan Targets
- Machined Components Targets
- Electronic Devices and Comp. (1) Targets
- Electronic Devices and Comp. (2) Motors
- Mitsumi Business (1) Targets
- Mitsumi Business (2) Optical Devices
- Mitsumi Business (3) Analog Semiconductors
- U-Shin Business Targets
- Construction of New Multi-purpose Factory
- Mission as CEO: Looking Back on My Tenure So Far
- Net Sales and Market Capitalization
- Path to 100 billion yen in operating income
- Mission as CEO: Looking Back on My Tenure So Far
- Laying the New Foundation for 100th Anniversary (1)
- Laying the New Foundation for 100th Anniversary (2)
- 70th Anniversary Dividend
- ESG Topics
- Forward-looking Statements
- Reference
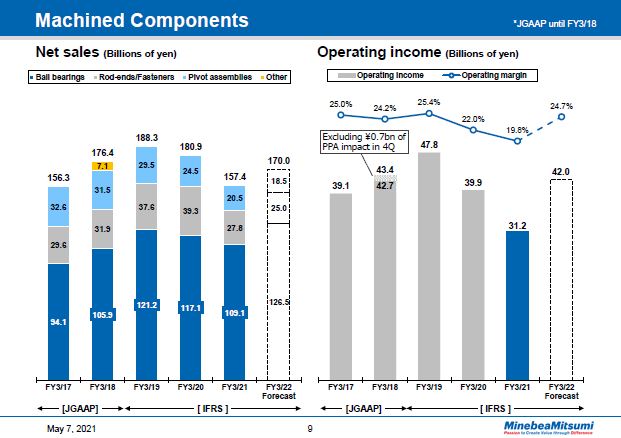
Now let's take a look at the results by segment, starting with machined components segment.
On the left is a graph indicating yearly net sales trends and on the right is a graph with a bar chart showing yearly operating income trends along with a line chart for operating margins.
In the fiscal year ended March 31, 2021, net sales were down 13.0% year on year to total 157.4 billion yen.
Sales of ball bearings decreased 6.8% year on year to reach 109.1 billion yen. The monthly average bearing sales volume totaled 208 million units for an increase of 10.1% year on year. Looking at sales by application, we see that annual sales of ball bearings used in data centers increased year on year, and flat for automobile applications, decreased for office automation equipment.
Sales of rod-ends and fasteners were down 29.1% year on year to total 27.8 billion yen.
Sales of pivot assemblies decreased 16.4% year on year to total 20.5 billion yen, steadily contributing to our bottom line as we held on to an 80% plus market share.
Operating income for the fiscal year ended March 31, 2021 totaled 31.2 billion yen, putting the operating margin at 19.8%. We saw operating income decrease 21.7% and the operating income margin decline 2.2 percentage points year on year. Looking at the year-on-year results by product, we see that profits for rod-ends and fasteners, ball bearings and pivot assemblies fell.
For the fiscal year ending March 31, 2022, we can see strong uptrend in demand for ball bearings in a wide range of applications, mainly for automobiles and for servers.
Sales for commercial aircraft including rod-ends and fasteners are expected to remain at the same level as the fiscal year ended March 31, 2021. This is due to the fact that it takes time to adjust inventories in the supply chain, although there are signs of recovery in aviation demand.
For pivot assembly, we anticipate a decline in demand as the HDD market shrinks.
9page (total 49pages)
![]() You need Adobe Reader® to view these documents. Click on Adobe Reader icon on the left to download the software from the Adobe Systems website.
You need Adobe Reader® to view these documents. Click on Adobe Reader icon on the left to download the software from the Adobe Systems website.
It ends about main text.


