Presentation Transcripts
Latest Update : June 2, 2021
Back to Financial Results (FY3/2021)
Investor Meeting Presentation for FY 3/2021 held on May 7, 2021
- Cove
- Today's Agenda
- Financial Results
- Summary of Consolidated Business Results
- Summary of Consolidated Business Results for 4Q
- Net Sales, Operating Income/margin Year
- Net Sales, Operating Income/margin Quarter
- 4Q Actual: Differences from the Forecast as of February
- Machined Components Year
- Machined Components Quarter
- Electronic Devices & Components Year
- Electronic Devices & Components Quarter
- Mitsumi Business Year
- Mitsumi Business Quarter
- U-Shin Business Year
- U-Shin Business Quarter
- Profit attributable to owners of the parent / EPS Year
- Profit attributable to owners of the parent / EPS Quarter
- Inventory
- Net interest-bearing debt / Free cash flow
- Forecast for Fiscal Year Ending March 31, 2022
- Forecast for Business Segment
- Changes of Business Segment
- Forecast for Business Segment (Adjusted)
- Management Policy & Business Strategy
- Summary of Fiscal Year ended 3/21
- Summary of Fiscal Year ending 3/22 Plan
- Mid-term Business Plan Targets
- Machined Components Targets
- Electronic Devices and Comp. (1) Targets
- Electronic Devices and Comp. (2) Motors
- Mitsumi Business (1) Targets
- Mitsumi Business (2) Optical Devices
- Mitsumi Business (3) Analog Semiconductors
- U-Shin Business Targets
- Construction of New Multi-purpose Factory
- Mission as CEO: Looking Back on My Tenure So Far
- Net Sales and Market Capitalization
- Path to 100 billion yen in operating income
- Mission as CEO: Looking Back on My Tenure So Far
- Laying the New Foundation for 100th Anniversary (1)
- Laying the New Foundation for 100th Anniversary (2)
- 70th Anniversary Dividend
- ESG Topics
- Forward-looking Statements
- Reference
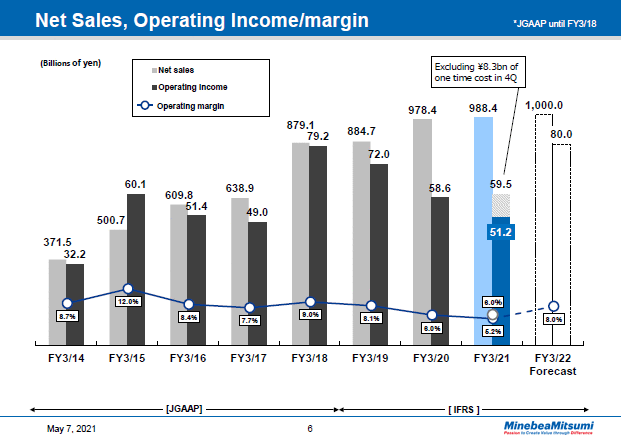
This is the annual trend in net sales, operating income and operating margin.
The bar graph on the left is net sales, and the one on the right is operating income along with a line chart for the operating margin.
The operating margin for the fiscal year ended Mach 2021 was 5.2%, down 0.8 percentage points year on year. If the effects of the aforementioned one-time expenses were not factored in, the operating margin would be 6.0% almost flat from the previous year.
Now, please note that figures of the fiscal year ended March 31, 2018 and before are based on JGAAP and are provided for your reference so that you can look at past figures. The same applies hereinafter.
6page (total 49pages)
![]() You need Adobe Reader® to view these documents. Click on Adobe Reader icon on the left to download the software from the Adobe Systems website.
You need Adobe Reader® to view these documents. Click on Adobe Reader icon on the left to download the software from the Adobe Systems website.
It ends about main text.


