Main Shareholders
Latest Update : Nov.19, 2025
As of September 30, 2025
Shareholders and Issued Shares
| Number of Shares Issued and Outstanding | 427,080,606 |
|---|---|
| Number of Shareholders | 32,579 |
Top Ten Major Shareholders
| Number of Shares Held | Shareholding Ratio (%) | |
|---|---|---|
| The Master Trust Bank of Japan, Ltd. (Trust Account) | 66,309,900 | 16.50% |
| CUSTODY BANK OF JAPAN, LTD. (TRUST ACCOUNT) | 28,383,398 | 7.06% |
| Takahashi Industrial and Economic Research Foundation | 15,447,330 | 3.84% |
| Sumitomo Mitsui Trust Bank, Limited | 15,413,900 | 3.83% |
| BNYM AS AGT/CLTS NON TREATY JASDEC | 15,271,097 | 3.80% |
| STATE STREET BANK AND TRUST COMPANY 505001 | 10,590,166 | 2.63% |
| Sumitomo Mitsui Banking Corporation | 10,233,597 | 2.54% |
| MUFG Bank, Ltd. | 10,181,739 | 2.53% |
| KI Business Partners Co., Ltd. | 10,100,000 | 2.51% |
| National Mutual Insurance Federation of Agricultural Cooperatives | 9,700,000 | 2.41% |
| Note: |
|
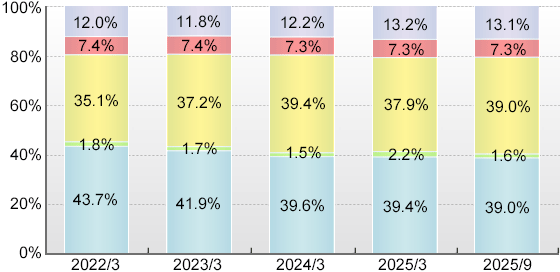
Breakdown of Shareholders by Type
Treasury stocks are included in the following "Individuals, Governments and Others".
| March 2022 | March 2023 | March 2024 | March 2025 | September 2025 | ||
|---|---|---|---|---|---|---|
| 1 unit | 100 shares |
100 shares |
100 shares |
100 shares |
100 shares |
|
| Japanese Financial Institutions | Number of Shares (Units) | 1,865,889 | 1,789,362 | 1,691,127 | 1,681,681 | 1,665,760 |
| Number of Holders | 59 | 58 | 55 | 57 | 60 | |
| Securities Co. | Number of Shares (Units) | 77,591 | 71,270 | 65,088 | 92,646 | 68,722 |
| Number of Holders | 50 | 40 | 41 | 53 | 41 | |
| Overseas Institutions | Number of Shares (Units) | 1,495,479 | 1,588,398 | 1,679,628 | 1,615,123 | 1,662,745 |
| Number of Holders | 695 | 698 | 694 | 736 | 730 | |
| Other Japanese Corporations | Number of Shares (Units) | 313,714 | 315,875 | 312,087 | 311,726 | 310,086 |
| Number of Holders | 301 | 325 | 284 | 311 | 313 | |
| Individuals, Governments and Others | Number of Shares (Units) | 513,605 | 501,440 | 518,650 | 565,435 | 559,301 |
| Number of Holders | 20,235 | 22,428 | 19,077 | 24,349 | 23,907 | |
| Total | Number of Shares (Units) | 4,266,278 | 4,266,345 | 4,266,580 | 4,266,611 | 4,266,614 |
| Number of Holders | 21,340 | 23,549 | 20,151 | 25,506 | 25,051 | |
| Odd-lot Shares (Shares) | 452,806 | 446,106 | 422,606 | 419,506 | 419,206 | |
Ratio of Shareholding by Type of Shareholder


