Presentation Transcripts
Latest Update : Aug.26, 2022
Back to Financial Results (FY3/2023)
Investor Meeting Presentation for 1Q FY 3/2023 held on August 5, 2022
- Cover
- Today's Agenda
- Financial Results
- Summary of Consolidated Business Results for 1Q
- Net Sales, Operating Income / Margin
- 1Q Actual: Differences from the Forecast as of May
- Machined Components
- Electronic Devices & Components
- MITSUMI Business
- U-Shin Business
- Profit Attributable to Owners of the Parent / EPS
- Inventory
- Net Interest-bearing Debt / Free Cash Flow
- Forecast for Fiscal Year Ending March 31, 2023
- Forecast for Business Segment
- Business Update & Management Strategy
- Today's Points
- Today's Points (2)
- 3 spears +1
- Growth strategy
- New M&A deals
- Commencement of TOB of HONDA TSUSHIN KOGYO CO., LTD
- Acquisition of All Shares of SUMIKO TEC CO., LTD.
- Solidify the Foundation as 8 Spear by Integrating 3 Companies
- Connectors' Future with Ultra High-Speed Communications
- Image of connector-related in-vehicle products after integration
- Solidify the Foundation as 8 spear by Integrating 3 Companies
- Acquisition of All Shares of Honda Lock Mfg. Co., Ltd.
- Strengthening the access products business via integration
- Expand automotive Tier1 business based on access products
- Strengthening the Access Products Business
- Name of New Tokyo Base and Shareholders Return, etc
- Forward-looking Statements
- Reference
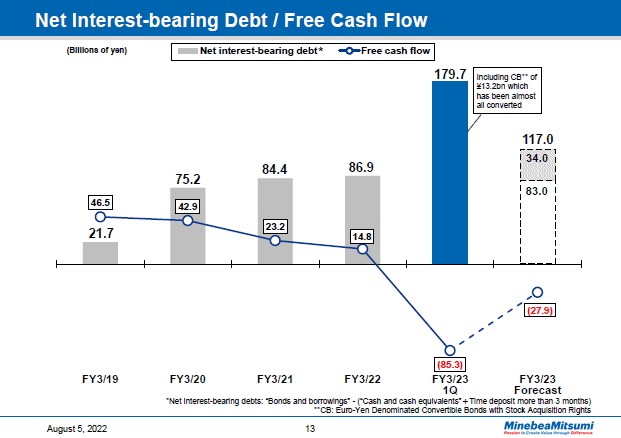
This graph contains a bar chart showing trends in net interest-bearing debt, which is total interest-bearing debt minus cash and cash equivalents, and a line chart indicating free cash flows.
At the end of the first quarter, net interest-bearing debt, totaling 179.7 billion yen, was up 92.8 billion yen from what it was at the end of the previous fiscal year. This is mainly due to the expenditure for the purchase of the new headquarters building as well as the increase in inventories.
Of this amount, 13.2 billion yen of CB (Euro-Yen Denominated Convertible Bonds with Stock Acquisition Rights) has been almost all converted by due date of redemption of August 3.
At the end of the fiscal year ending March 2023, the net interest-bearing debt forecast is expected to increase from the end of the previous fiscal year. However, excluding the expenditures for M&A announced recently, the net interest-bearing debt forecast is expected to be at the same level as the end of the previous fiscal year.
13page (total 53pages)
![]() You need Adobe Reader® to view these documents. Click on Adobe Reader icon on the left to download the software from the Adobe Systems website.
You need Adobe Reader® to view these documents. Click on Adobe Reader icon on the left to download the software from the Adobe Systems website.
It ends about main text.


