Main text is as follows.
Presentation Transcripts
Latest Update : Feb.16, 2018
Back to Financial Results (FY3/2018)
Investor Conference Call for 3Q FY 3/2018 held on February 7, 2018
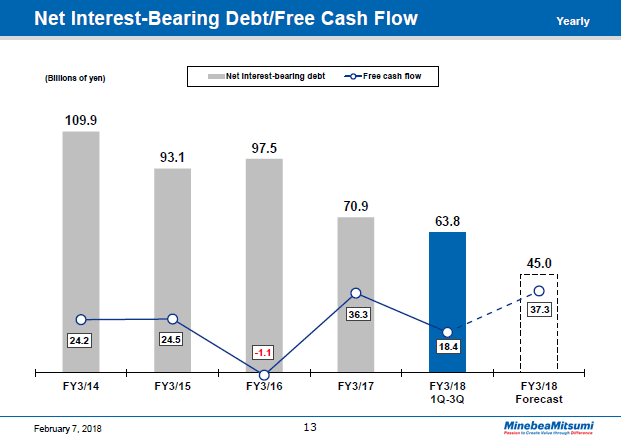
This graph contains a bar chart showing trends in net interest-bearing debt, which is total interest-bearing debt minus cash and cash equivalents, and a line chart indicating free cash flows.
At the end of the third quarter, net interest-bearing debt, totaling 63.8 billion yen, was down 7.1 billion yen from what it was at the end of the previous fiscal year.
This fiscal year we expect free cash flows to increase as profits grow and net interest-bearing debt decreases even further despite increasing capital expenditures.
In the meantime, we will continue to actively pursue M&A opportunities with an eye to medium-term growth.
13page (total 22pages)
 You need Adobe Reader® to view these documents. Click on Adobe Reader icon on the left to download the software from the Adobe Systems website.
It ends about main text.
menu related to this page is as follows.