Presentation Transcripts
Latest Update : Nov.21, 2016
Back to Financial Results (FY3/2017)
Investor Meeting Presentation for 2Q FY 3/2017 held on November 2, 2016
- Cover
- Table of contents
- Financial Results
- Summary of Consolidated Business Results for 1H
- Summary of Consolidated Business Results for 2Q
- Net Sales
- Operating Income
- Machined Components Business
- Electronic Devices & Components Business
- Net Income
- S.G. & A. Expenses
- Inventories
- Capital Expenditure & Depreciation
- Net Interest-Bearing Debt/Free Cash Flow
- Forecast for Fiscal Year Ending March 31, 2017
- FOREX impact on Minebea
- Policy and Strategy
- 1. Evaluation of 1H (FY 3/2017) Results
- 2. Full-year forecast (FY 3/2017)
- 3. External ball bearing sales steadily growing
- 4. Motor business to bring in steady income mainly from in-vehicle applications
- 5. Beefing up growth for sensing devices
- 6. Aircraft parts to focus on investments to grow
- 7. Status and Future of HDD-related Business
- 8. Current status of LED Backlight business
- 9. Integrating with MITSUMI with eye to next fiscal year and onward
- 10. LED backlights to remain in operation next year
- 11. Cambodian plant building #3 completed!
- 12. New Sartorius MT&H Bengaluru plant
- 13. Plan to build new Slovakia plant
- 14. Marketing strategies to new heights
- 15. Business / capital alliance with Iwasaki Electric
- 16. Financial Strategies: Share buyback as an anti-dilution measure
- 17. Financial Strategies: dividend
- 18. Financial Strategies: M&A Strategies
- Forward-looking Statements (1)
- Forward-looking Statements (2)
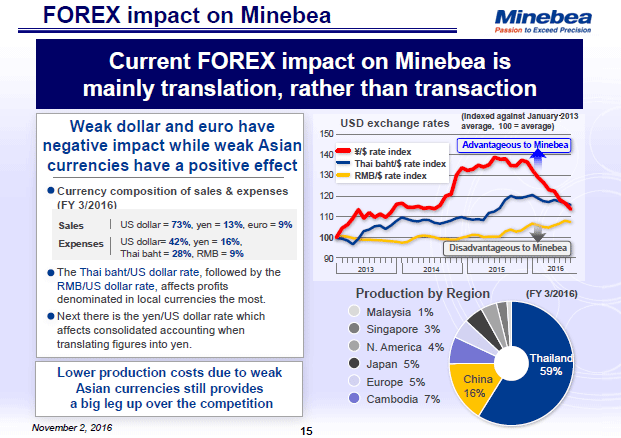
I would like to explain our currency exposure situation with this slide.
We think our currency exposure can be explained in two different stages since, as you can see in the pie chart in the lower right hand, more than 95% of Minebea's production takes place outside of Japan.
In the first stage, we will consider our overseas subsidiaries on the basis of foreign currency. In terms of net currency exposure, which is the sum of sales and expenses, we were net long position for the US dollar and net short for the Thai baht and the Chinese renminbi. Therefore, if Asian currencies become weaker against the US dollar, there is a tail wind for our foreign currency denominated profits. In the second stage, if the Japanese yen becomes weaker against the US dollar, when we consolidate these foreign currency denominated profits to Japanese yen-based accounting, there is a tail wind.
As you can see in the upper right hand line graph, the Thai baht and the Chinese renminbi remain weak against the US dollar in recent years. On the other hand, the Japanese yen is becoming stronger against the US dollar. During this fiscal year, since the Thai baht and the Chinese renminbi stayed in ranges against the US dollar, the second stage currency impact, that is, translation impact on the Japanese yen is the main factor. Although there was a negative impact from the stronger Japanese yen, we think it is still a better currency environment for Minebea, as the weaker Asian currencies make our production cost structure stronger.
16page (total 37pages)
![]() You need Adobe Reader® to view these documents. Click on Adobe Reader icon on the left to download the software from the Adobe Systems website.
You need Adobe Reader® to view these documents. Click on Adobe Reader icon on the left to download the software from the Adobe Systems website.
It ends about main text.


