Presentation Transcripts
Latest Update : May 28, 2025
Back to Financial Results (FY3/2025)
Presentation for FY 3/2025 held on May 9, 2025
- Cover
- Today's Agenda
- Financial Results Overview and Forecast
- Summary of Consolidated Financial Results for the Fiscal Year
- Summary of Consolidated Financial Results for 4Q
- Net Sales, Operating Income, and Operating Income Margin
- Quarterly Trends: Net Sales, Operating Income, and Operating Income Margin
- 4Q Results: Variance from Previous Forecast (Announced February 5, 2025)
- Precision Technologies Segment (PT)
- Quarterly Trends: Precision Technologies Segment (PT)
- Motor, Lighting & Sensing Segment (MLS)
- Quarterly Trends: Motor, Lighting & Sensing Segment (MLS)
- Semiconductor & Electronics Segment (SE)
- Quarterly Trends: Semiconductor & Electronics Segment (SE)
- Access Solutions Segment (AS)
- Quarterly Trends: Access Solutions Segment (AS)
- Profit Attributable to Owners of the Parent / EPS
- Quarterly Profit Attributable to Owners of the Parent / EPS
- Inventories
- Net Interest-Bearing Debt and Free Cash Flow
- Earnings Forecast for FY3/26
- Segment Changes
- Earnings Forecast for FY3/26 by Segment (Base Scenario)
- Earnings Forecast for FY3/26 by Segment (Risk Scenario)
- Management Policy & Business Strategy
- FY3/25 Highlights
- FY3/26 Earnings Forecast (Base Scenario)
- ① Impact of US Reciprocal Tariffs
- FY3/26 Risk Scenario Assumptions
- Net Sales and Operating Income Forecast for FY3/26 (by Segment)
- ② Plans for the FY3/26
- Long-Term Trend in Net Sales and Operating Income
- Precision Technologies Segment (PT) Outlook
- Motor, Lighting & Sensing Segment (MLS) Outlook
- Semiconductor & Electronics Segment (SE) Outlook
- Access Solutions Segment (AS) Outlook
- ③ M&A Deal
- Commencement of Tender Offer of Shares of SHIBAURA ELECTRONICS CO., LTD.
- Significance of Business Integration with SHIBAURA ELECTRONICS [1/2]
- Significance of Business Integration with SHIBAURA ELECTRONICS [2/2]
- Our M&A Principles
- ④ Initiatives for Medium- to Long term Growth
- Integration of the Core Businesses
- Products Supporting the Future World [1/2]
- Products Supporting the Future World [2/2]
- Robot Hand Development Project in Progress
- Products for Solving Social Issues
- ESG (Environment)
- ⑤ Shareholder Returns
- Dividends
- Forward-looking Statements
- Reference
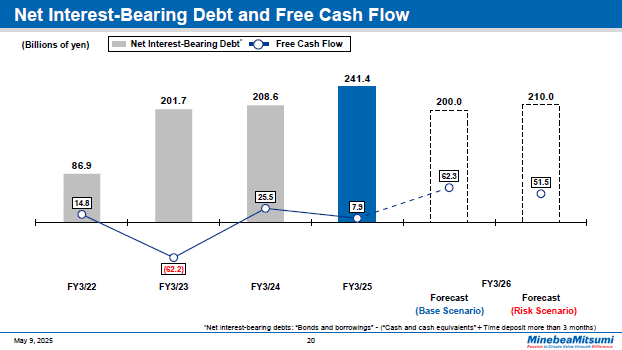
This graph contains a bar chart showing trends in net interest-bearing debt, which is total interest-bearing debt minus cash and cash equivalents, and a line chart indicating free cash flows.
At the end of the fourth quarter, net interest-bearing debt, totaling 241.4 billion yen, was up by 32.8 billion yen from what it was at the end of the previous fiscal year.
This mainly includes expenditures related to the M&A of Minebea Power Semiconductor Device.
As for free cash flow for the fiscal year ending March 31, 2026, we currently do not factor in any M&A-related expenditures.
20page (total 65pages)
![]() You need Adobe Reader® to view these documents. Click on Adobe Reader icon on the left to download the software from the Adobe Systems website.
You need Adobe Reader® to view these documents. Click on Adobe Reader icon on the left to download the software from the Adobe Systems website.
It ends about main text.


