Presentation Transcripts
Latest Update : Mar.9, 2023
Back to Financial Results (FY3/2023)
Investor Conference Call for 3Q FY 3/2023 held on February 3, 2023
- Cover
- Summary of Consolidated Business Results for 3Q
- Net Sales, Operating Income / Margin
- 3Q Actual: Differences from the Forecast as of November
- Machined Components
- Electronic Devices & Components
- MITSUMI Business
- U-Shin Business
- Profit Attributable to Owners of the Parent / EPS
- Inventory
- Net Interest-bearing Debt / Free Cash Flow
- Forecast for Fiscal Year Ending March 31, 2023
- Forecast for Business Segment
- Today's Points (1)
- Today's Points (2)
- Vision for the Next Fiscal Year
- Super Bearings to Go on Sale
- Creating Synergies in Access Products
- Share Buyback
- ESG Topics
- Forward-looking Statements
- Reference
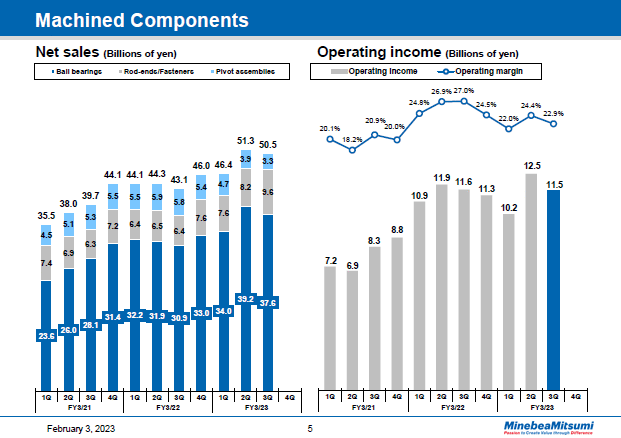
Now let's take a look at the results by segment, starting with the machined components business segment. On the left is a graph indicating quarterly net sales trends and on the right is a graph with a bar chart quarterly operating income trends along with a line chart for operating margins.
Third quarter net sales decreased 1.6% quarter on quarter to total 50.5 billion yen.
Sales of ball bearings decreased 4.1% quarter on quarter to total 37.6 billion yen. The monthly external shipment volume was down 10.4% quarter on quarter for an average of 225 million units. This is due to a slowdown in the markets, mainly the data center market.
Sales of rod-ends and fasteners, totaling 9.6 billion yen, were up 16.5% over the previous quarter. Sales increased due to a recovery in aircraft production.
Sales of pivot assemblies decreased 14.3% quarter on quarter to total 3.3 billion yen.
Operating income for the quarter totaled 11.5 billion yen, and the operating margin was 22.9%. On a quarter-on-quarter basis, operating income decreased 7.8% while the operating margin dropped 1.5 percentage points.
Looking at the results by product, we see that operating income for ball bearings and pivot assemblies decreased quarter on quarter while operating income for rod-ends and fasteners was up compared with last quarter.
5page (total 30pages)
![]() You need Adobe Reader® to view these documents. Click on Adobe Reader icon on the left to download the software from the Adobe Systems website.
You need Adobe Reader® to view these documents. Click on Adobe Reader icon on the left to download the software from the Adobe Systems website.
It ends about main text.


