Now let's take a look at the results by segment, starting with machined components business segment.
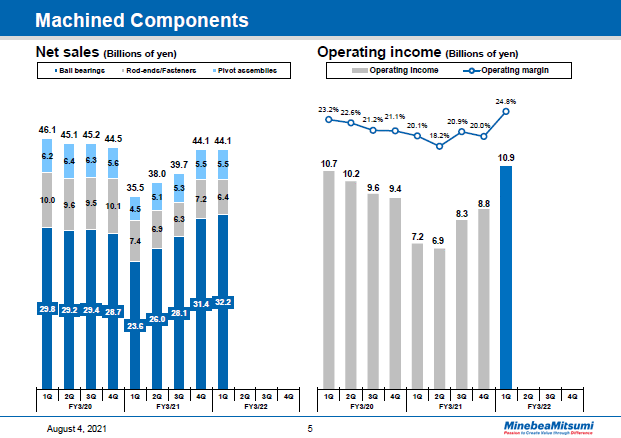
On the left is a graph indicating quarterly net sales trends and on the right is a graph with a bar chart quarterly operating income trends along with a line chart for operating margins.
First quarter net sales were almost on a par with previous quarter to total 44.1 billion yen.
Ball bearing sales increased 2.5% quarter on quarter to total 32.2 billion yen. The monthly external shipment volume was up 1.2% quarter on quarter for an average of 246 million units. The growing shipment volume of data center ball bearings continued to drive sales upward. Sales of aircraft bearings remained sluggish due to the stagnant market.
Sales of rod-ends and fasteners, totaling 6.4 billion yen, were down 11.1% from the previous quarter. Although this has not yet led to an improvement in net sales at this point, we are seeing bright signs in the aircraft sales.
Sales of pivot assemblies remained at the same level quarter on quarter to total 5.5 billion yen.
Operating income for the quarter totaled 10.9 billion yen, and the operating margin was 24.8% which surpass the level before COVID-19. On a quarter-on-quarter basis, operating income rose 23.5% while the operating margin improved 4.8 percentage points. Looking at the results by product, we see that profits for ball bearings, rod-ends/fasteners, and pivot assemblies all increased quarter on quarter.