Presentation Transcripts
Latest Update : Nov.19, 2013
Back to Financial Results (FY3/2014)
Investor Meeting Presentation for 2Q FY 3/2014 held on November 1, 2013
- Cover
- Table of Contents
- Financial Results
- Summary of Consolidated Business Results for 1H
- Summary of Consolidated Business Results for 2Q
- Net Sales
- Operating Income
- Machined Components Business
- Electronic Devices & Components Business
- Net Income
- S.G. & A. Expenses
- Inventories
- Capital Expenditure & Depreciation
- Net Interest-Bearing Debt
- Forecast for Fiscal Year Ending March 31, 2014
- Forecast for Business Segment
- Policy and Strategy
- Forecast revised upward
- Forecast revised upward - our actions
- Drastic Changes in the Market
- Forecast revised upward -Drastic Upturn in the Market-
- Remarkable turnaround in the first half
- The Five Arrows
- LED Lighting
- Measuring Components
- Growth drivers for the next year leading to the Five Arrows
- Immediate growth driver 1
- Immediate growth driver 2
- Immediate growth driver 3
- Immediate growth driver 4
- Application of ceramic bearings in aerospace
- Improve balance sheet (1)
- Improve balance sheet (2)
- M&A and alliance strategies
- Dividend policy
- Forward-looking Statements
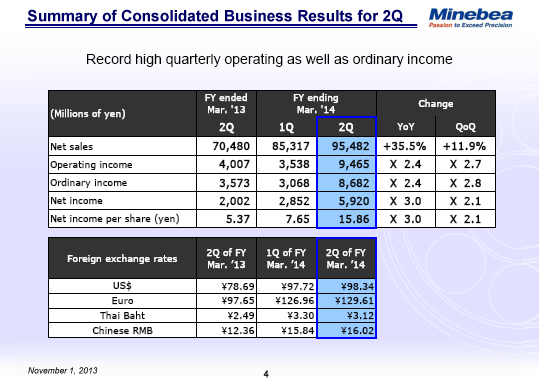
For the second quarter of the fiscal year ending March 31, 2014, net sales were 95,482 million yen. That's up 35.5% from the same period last year and an increase of 11.9% over the previous quarter. Operating income was 9,465 million yen, 2.4 times that of the same period last year and 2.7 times that of the previous quarter. Net income totaled 5,920 million yen, 3.0 times that of the same period last year and 2.1 times that of the previous quarter.
These quarterly sales as well as operating income and ordinary income figures are record highs since we started disclosing our quarterly performance results in the fiscal year ended March 31, 2002. We estimated the foreign exchange gains for sales, mainly due to the weaker Japanese yen, to be approximately 15.9 billion yen on a year-on-year basis and 0.5 billion yen on a quarter-on-quarter basis. Foreign exchange gains also boosted operating income an estimated 2.4 billion yen year on year and 1.8 billion yen quarter on quarter mainly due to weaker emerging countries' currencies such as Thai baht. Those positive impacts were amplified by the lowered production costs in terms of local currencies such as Thai baht caused by increased production volume and better efficiency.
5page (total 36pages)
![]() You need Adobe Reader® to view these documents. Click on Adobe Reader icon on the left to download the software from the Adobe Systems website.
You need Adobe Reader® to view these documents. Click on Adobe Reader icon on the left to download the software from the Adobe Systems website.
It ends about main text.


