


ESG related Information
FY3/2025 Environmental Data
Environmental Impact of MinebeaMitsumi Group
The Group has 129 production and R&D sites and 100 sales offices in 28 countries around the world. We produce and sell a diverse range of products including bearings (our main product), machined components, electronic devices, and semiconductor products and so on.
The Group's environmental impact for the fiscal year ending March 2025 is as follows.
Input and Output (FY3/2025 Actual)
- LPG: Liquefied petroleum gas
- PRTR chemicals: Chemical substances reported to the administration according to the PRTR Law. (Japanese Domestic Law)
- GHG(CO2 equivalent): Greenhouse gases converted to CO2 amounts using the global warming potential. (CH4, HFC, PFC, SF6, NF3, N2O)
- NOx: Nitrogen oxides. Causative agent of photochemical smog and acid rain.
- SOx: Sulfur oxides. Causative agent of asthma and acid rain.
- Particulates: Microscopic solid matter contained in exhaust gas generated through combustion. Larger particles reduce visibility, while smaller particles are respiratory organs and other health impacting substance.
- Waste: valuables and wastes
- COD: Chemical oxygen demand. An indicator used for environmental standards for organic matter in marine areas and lakes.
- BOD: Biochemical oxygen demand. An indicator used in environmental standards for organic matter in rivers.
- SS: Suspended solids in water. An indicator used for the turbidity of water used in environmental standards for insoluble substances in water.
Greenhouse Gas Emissions of MinebeaMitsumi Group
CO2 equivalent emissions of greenhouse gases (Total and Per Basic Sales Unit)
* Scope2 : Market-based
For the fiscal year ended March 2025, the Group's overall greenhouse gas emissions were 789,768 tons of CO2 equivalent, a decrease of 9.0% from the previous fiscal year. Sales decreased compared to an increase of 8.6% due to improved production efficiency and the introduction of renewable energy.
Greenhouse gas emissions per unit of sales were 0.519 tons per million yen, a 16.2% decrease compared to the previous fiscal year, as the rate of increase in CO2-equivalent emissions was less than the rate of increase in sales.
Supply chain emissions (Scope1,2,3)
| '25/3 | Veri-fied | ||||
|---|---|---|---|---|---|
| Scope1 | 90 | ● | |||
| Scope2 * | 700 | ● | |||
| Scope3 | 61,302 | ● | Scope3 Calculation method for each category | ||
| Category 1 | Purchased goods and services | 4,559 | ● | Purchase price × emission coefficient | |
| Category 2 | Capital goods | 327 | ● | Amount of purchased capital goods × emission coefficient | |
| Category 3 | Fuel-and energy-related activities (not included in scope 1 or scope 2) | 132 | ● | Energy used(fuel and electricity) × emission coefficient for each type | |
| Category 4 | Upstream transportation and distribution | 259 | ● | Transport weight × transport distance and fuel consumption × emission coefficient for each type | |
| Category 5 | Waste generated in operations | 15 | ● | Amount of waste × emission coefficient for each type | |
| Category 6 | Business travel | 13 | ● | Number of employees × emission coefficient | |
| Category 7 | Employee commuting | 50 | ● | Number of workdays by work type and city category × emission coefficient for each type | |
| Category 8 | Uptream leased assets | — | Not applicable | ||
| Category 9 | Downstream transportation and distribution | 0.1 | ● | Transport weight and transport distance of our finished products and fuel consumption × emission coefficient | |
| Category 10 | Processing of sold products | 679 | ● | Manufacturing cost of our products × emission coefficient | |
| Category 11 | Use of sold products | 55,259 | ● | Lifetime electricity consumption of our product × emission coefficient | |
| Category 12 | End-of-life treatment of sold products | 7 | ● | Sales of our products × emission coefficient | |
| Category 13 | Downstream leased assets | — | Not applicable | ||
| Category 14 | Franchises | — | Not applicable | ||
| Category 15 | Invesments | 2 | ● | Scope1,2 emissions of investment target companies × company's shareholding ratio | |
*: Market-base ●: Data Verified by Third party
Results of FY3/2025 Initiatives
For the fiscal year ended March 2025, 122,112 tons of steel and 38,050 tons of resin were used, the total was almost unchanged compared to the previous fiscal year.
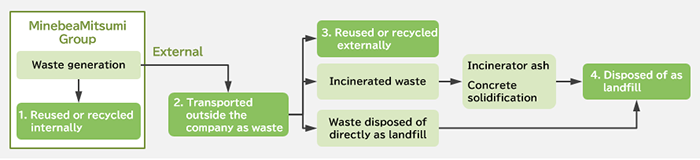
The amount of "Transported outside the company as waste" totaled 116,020 tons, an increase of 6.3% from the previous year.
In comparison with the medium-term environmental targets for waste, "Reduction of waste emissions per unit of sales by 24% achieved the target of 10% reduction with the fiscal year ended March 2020 by the fiscal year ending March 2026."
In addition, the actual recycling rate of 97.1% achieved the target recycling rate of 93.5%.
Waste Processed (FY3/2025 Actual)
Waters amount/Usage per unit of sales/Recycling rate
Flow of Waste Generated by MinebeaMitsumi Group and Confirmation Methods
Water withdrawal of MinebeaMitsumi Group
Water withdrawal
For the fiscal year ended March 2025, the Group's water consumption was 10,854,988㎥ an increase of 21.2% compared to the previous fiscal year.
From April 2025, we set new medium-term environmental targets for water withdrawal and are working to reduce them.
Management of PRTR-controlled Substances (Japan)
In accordance with the Pollutant Release and Transfer Register (PRTR) Law, all of our places of business in Japan manage the amounts of PRTR-controlled substances used and transported.
Reported Results for FY3/2025
| Control number | CAS No. | Substance name | Volume handled | Emission Volumes | Transfer volumes | Volume consumed | Removal treatment | |||
|---|---|---|---|---|---|---|---|---|---|---|
| Air | Water | Landfill | Waste | Sewerage | ||||||
| 20 | 141-43-5 | 2-Aminoethanol | 28.21 | 0 | 0 | 0 | 28.21 | 0 | 0 | 0 |
| 53 | 100-41-4 | Ethylbenzene | 4.51 | 4.51 | 0 | 0 | 0 | 0 | 0 | 0 |
| 80 | 1330-20-7 | Xylene | 8.39 | 5.59 | 0 | 0 | 2.80 | 0 | 0 | 0 |
| 213 | 127-19-5 | N,N- Dimethylacetamide |
2.56 | 0.10 | 0 | 0 | 2.46 | 0 | 0 | 0 |
| 232 | 68-12-2 | N,N- Dimethylformamide |
21.77 | 6.47 | 0 | 0 | 15.30 | 0 | 0 | 0 |
| 300 | 108-88-3 | Toluene | 10.67 | 10.67 | 0 | 0 | 0 | 0 | 0 | 0 |
| 333 | 7803-57-8 | Hydrazine hydrate | 2.16 | 0.03 | 0 | 0 | 1.53 | 0 | 0.60 | 0 |
| 343 | 120-80-9 | Catechol | 1.48 | 0 | 0 | 0 | 1.48 | 0 | 0 | 0 |
| 349 | 108-95-2 | Phenol | 3.58 | 0.18 | 0 | 0 | 3.40 | 0 | 0 | 0 |
| 374 | - | Hydrogen fluoride and its water-soluble salts | 59.43 | 0.24 | 0.58 | 0 | 6.56 | 1.22 | 0 | 50.83 |
| 438 | 1321-94-4 | Methylnaphthalene | 4.97 | 0.15 | 0 | 0 | 2.99 | 0 | 1.83 | 0 |
| 691 | 25551-13-7 | Trimethylbenzene | 8.08 | 2.70 | 0 | 0 | 5.38 | 0 | 0 | 0 |
| 697 | 1314-41-6 | lead oxide | 41.18 | 0 | 0 | 0 | 0.68 | 0 | 40.50 | 0 |
| 731 | 142-82-5 | Heptane | 2,65 | 1.38 | 0 | 0 | 1.27 | 0 | 0 | 0 |
| 737 | 108-10-1 | Methyl isobutyl ketone | 3.06 | 3.06 | 0 | 0 | 0 | 0 | 0 | 0 |
| 746 | 872-50-4 | N-Methyl-2-pyrrolidone | 1.60 | 0.07 | 0 | 0 | 1.53 | 0 | 0 | 0 |
| Total | 204.30 | 35.73 | 74.81 | 0 | 93.76 | |||||
Environmental Accounting of the MinebeaMitsumi Group
Environmental conservation costs
The Group conducts environmental accounting to confirm its costs for environmental protection activities.The Japanese Ministry of the Environmental Accounting Guidelines 2005 is used as a reference.
The Group's environmental conservation costs totaled 9.1 billion yen in FY3/2025, a decrease compared to the previous year.
FY3/2025 Environmental Conservation Costs
| Environmental Protection Activity Costs | Total | ||||
|---|---|---|---|---|---|
| Category | Activity | Investment | Expense | ||
| 1 | Costs to minimize the environmental impact from manufacturing and service activities within the business area | As set forth in breakdown for (1), (2), and (3) | 1,381 | 5,458 | |
| (Business area costs) | |||||
| Breakdown | (1) Pollution prevention costs | Costs related to installation, disposal, operation, maintenance, management, etc. of facilities to prevent water and air pollution | 161 | 1,555 | |
| (2) Environmental protection costs | Costs for installation of ozone-depleting substance (ODS)-free water-based cleaning facilities, high-efficiency refrigerators, Installing transformers and air compressors, switching to LED lighting ,depreciation, operating and maintenance costs, etc. | 819 | 2,452 | ||
| (3) Resource recycling costs | Equipment and costs for waste disposal and recycling | 401 | 1,451 | ||
| 2 | Costs to reduce environmental burden in upstream and downstream processes caused by manufacturing or services activities | Costs related to analyzer installation and materials analysis as part of the Green Procurement Program; printing and revenue stamp costs for contracts with suppliers, etc. | 8 | 145 | |
| (Upstream/downstream costs) | |||||
| 3 | Administrative activity-related environmental conservation costs (Administrative costs) | Personnel, maintenance and management costs for environmental management system, etc. | 17 | 681 | |
| 4 | R&D activity-related environmental conservation costs (R&D costs) | Costs related to the research and development of water-based cleaning facilities, etc. | 56 | 1,328 | |
| 5 | Community activity-related environmental conservation costs (Community activity costs) | Costs related to greening programs, landscape preservation, etc. | 0 | 11 | |
| 6 | Environmental remediation-related costs | Costs related to soil replacement and operation, maintenance and depreciation of water-based cleaning facilities for the remediation of soil | 1 | 7 | |
| (Environmental remediation costs) | |||||
| Total | 1,463 | 7,630 | |||
1USD=¥143.31 1EUR=¥155.18 1THB=¥4.08 1CNY=¥20.03
1SGD=¥106.54 1GBP=¥179.44 1MYR=¥30.97 1PHP=¥2.59


